Helper to specify comp_heatmap annotation for categorical sample data
Source:R/heatmaps-sampleAnnotation.R
anno_sample_cat.RdUse this as an argument to sampleAnnotation(), which itself is used by comp_heatmap() as sample_anno argument.
Usage
anno_sample_cat(
  var,
  col = distinct_palette(),
  renamer = identity,
  size = grid::unit(5, "mm"),
  legend = TRUE,
  legend_title = "",
  box_col = "white",
  box_lwd = 0.5,
  border_col = NA,
  border_lwd = 1,
  data = NULL,
  samples = NULL,
  which = NULL,
  ...
)
Arguments
- var
name of variable to use for annotation data
- col
colors vector, at least as long as unique(x), optionally named by x levels
- renamer
function to rename levels of variable
var- size
width or height as a grid unit object
- legend
generate legend for this annotation (attached as attribute of heatmap, and not automatically included in plot)
- legend_title
title for legend, if drawn
- box_col
colour of boxes around individual cells
- box_lwd
line width of boxes around individual cells
- border_col
colour of border around all cells
- border_lwd
line width of border around all cells
- data
OPTIONAL phyloseq or psExtra, only set this to override use of same data as in heatmap
- samples
OPTIONAL selection vector of sample names, only set this if providing data argument to override default
- which
OPTIONAL indicating if it is a 'column' or a 'row' annotation, only set this if providing data argument to override default
- ...
Arguments passed on to
anno_catxdata vector, treated as categorical
widthgrid unit object or NULL
heightgrid unit object or NULL
Examples
library("ComplexHeatmap")
data("ibd", package = "microViz")
psq <- ibd
samples <- phyloseq::sample_names(psq)

# makes a function that takes data, taxa and which (at minimum)
fun <- anno_sample_cat(var = "ibd")

# manually specify the prevalence barplot function by giving it data etc.
heatmapAnnoFunction <- fun(data = psq, which = "row", samples = samples)

# draw the barplot without a heatmap, you will never normally do this!
vp <- viewport(width = 0.75, height = 0.75)

grid::grid.newpage()
pushViewport(vp)
draw(heatmapAnnoFunction)
# A legend is attached by default to anno_cat() output, let's plot that.
pushViewport(viewport(x = 0.75))
draw(attr(heatmapAnnoFunction, "Legend"))


# change some options and specify the data up front
grid::grid.newpage()
pushViewport(vp)
anno_sample_cat(
  data = psq, var = "DiseaseState", samples = samples, which = "column",
  size = grid::unit(5, "cm"), col = distinct_palette(pal = "kelly")
) %>%
  draw()
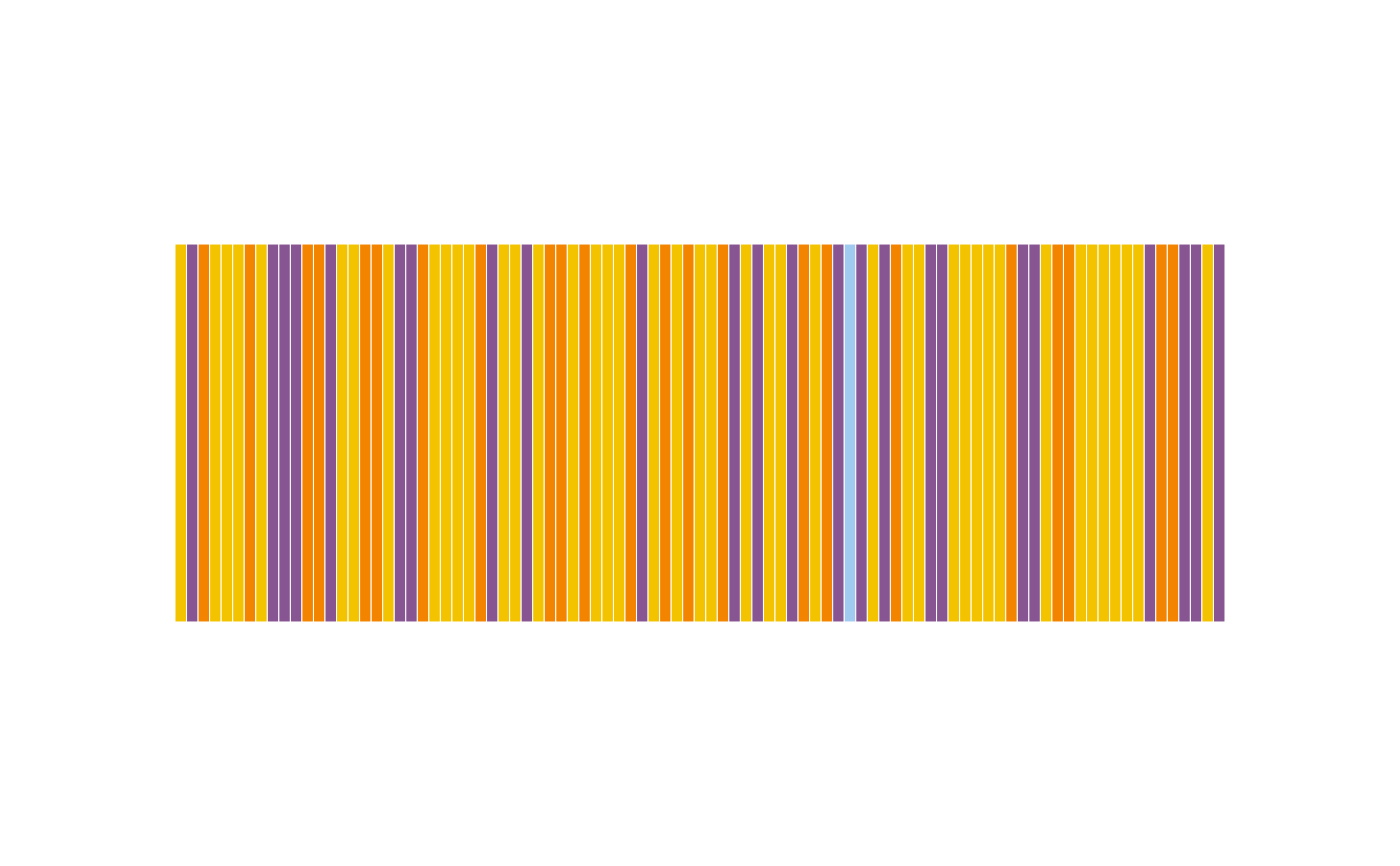
# change some options and specify the data up front
grid::grid.newpage()
pushViewport(vp)
anno_sample_cat(
data = psq, var = "DiseaseState", samples = samples, which = "column",
size = grid::unit(5, "cm"), col = distinct_palette(pal = "kelly")
) %>%
draw()