Helper to specify heatmap annotation for showing taxa abundance on boxplot
Source:R/heatmaps-taxAnnotation.R
anno_tax_box.RdUse this as an argument to taxAnnotation(), which itself is used by cor_heatmap and comp_heatmap as tax_anno argument.
Usage
anno_tax_box(
  undetected = 0,
  only_detected = TRUE,
  trans = "compositional",
  zero_replace = 0,
  use_counts = TRUE,
  size = grid::unit(30, "mm"),
  border = TRUE,
  gp = grid::gpar(fill = "#CCCCCC"),
  ylim = NULL,
  extend = 0.05,
  outline = TRUE,
  box_width = 0.6,
  pch = 1,
  pointsize = grid::unit(0.5, "mm"),
  axis = TRUE,
  ...,
  data = NULL,
  taxa = NULL,
  which = NULL
)
Arguments
- undetected
the value above which taxa are classed as detected/present in a sample
- only_detected
only plot values for samples where the taxon abundance is > undetected
- trans
name of transformation suitable for tax_transform, or a function calling tax_transform, and/or tax_scale, (a function must take a phyloseq or psExtra, and return one)
- zero_replace
zero_replace value for for tax_transform, ignored if trans is a function
- use_counts
try to retrieve counts from data object?
- size
width or height as a grid unit object
- border
Wether draw borders of the annotation region?
- gp
Graphic parameters for the boxes. The length of the graphic parameters should be one or the number of observations.
- ylim
Data ranges.
- extend
The extension to both side of
ylim. The value is a percent value corresponding toylim[2] - ylim[1].- outline
Whether draw outline of boxplots?
- box_width
Relative width of boxes. The value should be smaller than one.
- pch
Point style.
- pointsize
size of outlier points, as grid::unit() object
- axis
Whether to add axis?
- ...
Arguments passed on to
ComplexHeatmap::anno_boxplotaxis_paramparameters for controlling axis. See
default_axis_paramfor all possible settings and default parameters.
- data
OPTIONAL phyloseq or psExtra, only set this to override use of same data as in heatmap
- taxa
OPTIONAL selection vector of taxa (names, numbers or logical), only set this if providing data argument to override default
- which
OPTIONAL indicating if it is a 'column' or a 'row' annotation, only set this if providing data argument to override default
Examples
library("ComplexHeatmap")
data("ibd", package = "microViz")
psq <- tax_filter(ibd, min_prevalence = 5)
psq <- tax_mutate(psq, Species = NULL)
psq <- tax_fix(psq)
psq <- tax_agg(psq, rank = "Family")
taxa <- tax_top(psq, n = 15, rank = "Family")
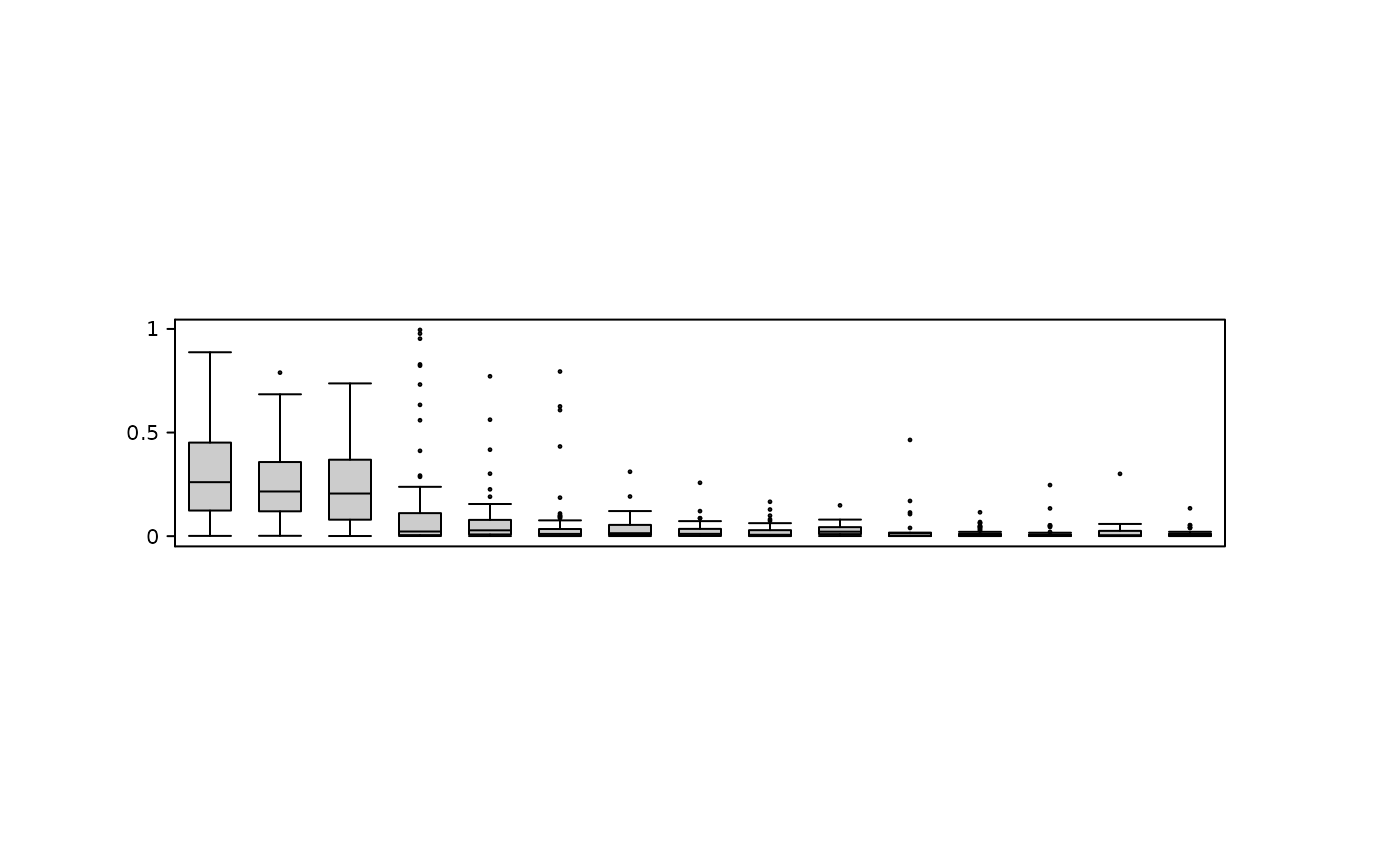
# makes a function that takes data, taxa and which (at minimum)
fun <- anno_tax_box()
# manually specify the prevalence barplot function by giving it data etc.
heatmapAnnoFunction <- fun(data = psq, which = "column", taxa = taxa)
# draw the barplot without a heatmap, you will never normally do this!
vp <- viewport(width = 0.75, height = 0.75)
grid.newpage()
pushViewport(vp)
draw(heatmapAnnoFunction)
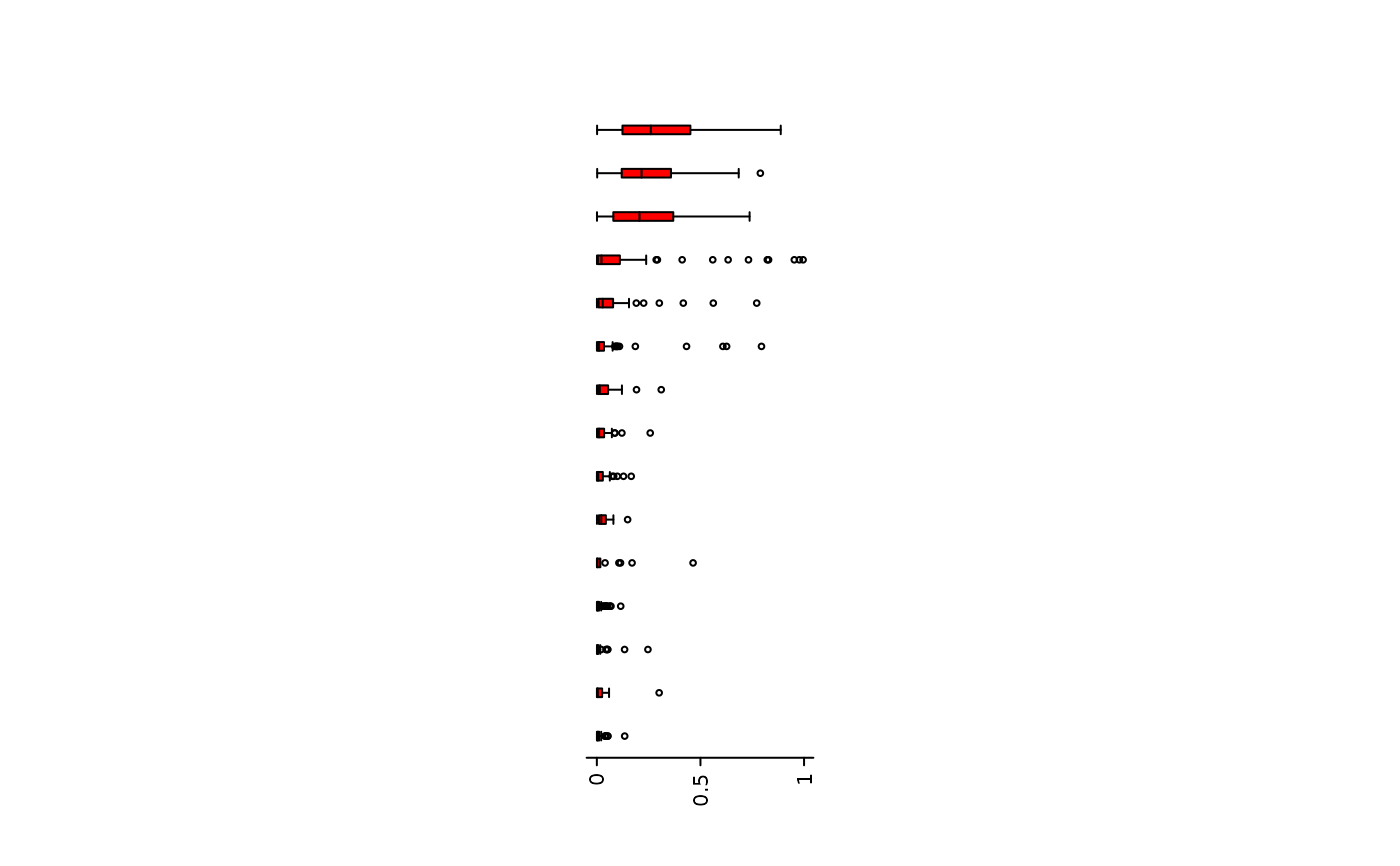
 # let's change some style options and specify the data up front
grid::grid.newpage()
pushViewport(vp)
draw(anno_tax_box(
data = psq, taxa = taxa, which = "row", pointsize = grid::unit(1, "mm"),
gp = grid::gpar(fill = "red"), border = FALSE, box_width = 0.2
))
# let's change some style options and specify the data up front
grid::grid.newpage()
pushViewport(vp)
draw(anno_tax_box(
data = psq, taxa = taxa, which = "row", pointsize = grid::unit(1, "mm"),
gp = grid::gpar(fill = "red"), border = FALSE, box_width = 0.2
))
 # clear drawings
grid::grid.newpage()
# clear drawings
grid::grid.newpage()