Helper to specify heatmap annotation for variable distribution histograms
Source:R/heatmaps-varAnnotation.R
anno_var_hist.RdUse this as an argument to varAnnotation(), which itself is used by cor_heatmap var_anno argument.
Arguments
- fun
function applied to all variables, with apply()
- size
width or height as a grid unit object
- n_breaks
number of breaks
- border
Wether draw borders of the annotation region?
- gp
Graphic parameters for the boxes. The length of the graphic parameters should be one or the number of observations.
- axis
Whether to add axis?
- ...
Arguments passed on to
ComplexHeatmap::anno_densityaxis_paramparameters for controlling axis. See
default_axis_paramfor all possible settings and default parameters.
- data
OPTIONAL phyloseq or psExtra, only set this to override use of same data as in heatmap
- vars
OPTIONAL selection vector of variable names, only set this if providing data argument to override default
- which
OPTIONAL indicating if it is a 'column' or a 'row' annotation, only set this if providing data argument to override default
Examples
library(ComplexHeatmap)
set.seed(123)
fakeData <- as.data.frame.matrix(matrix(rnorm(500, 10, 3), ncol = 10))
names(fakeData) <- paste0("var_", 1:10)
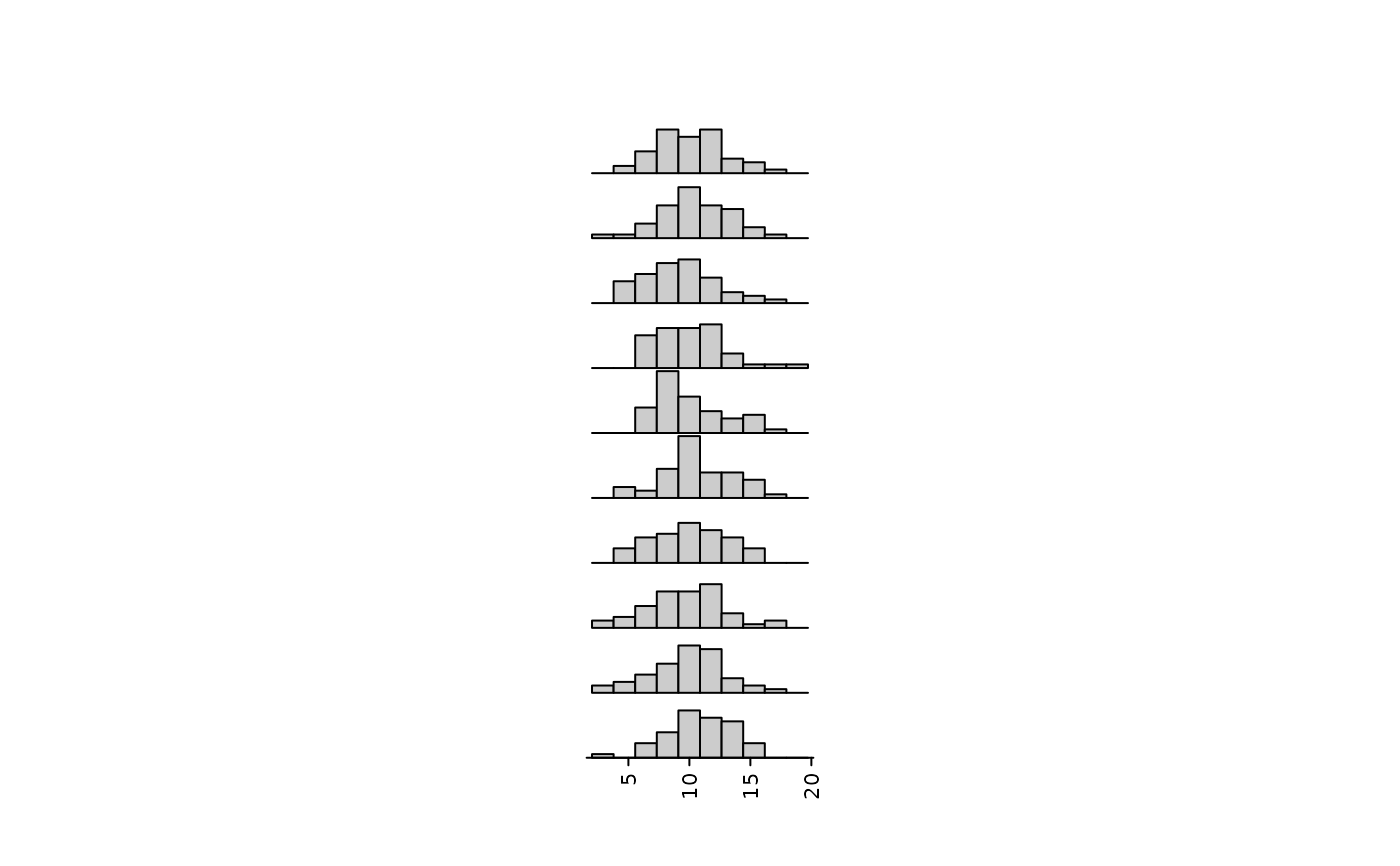
# draw the histograms without a heatmap, you will never normally do this!
vp <- viewport(width = 0.75, height = 0.75)
grid.newpage()
pushViewport(vp)
draw(
anno_var_hist(data = fakeData, vars = names(fakeData), which = "row")
)
 grid.newpage()
pushViewport(vp)
draw(
anno_var_hist(
data = fakeData, fun = sqrt,
vars = rev(names(fakeData)), n_breaks = 5,
which = "column", gp = grid::gpar(fill = 2:6, lwd = c(0.9, 2.5))
)
)
grid.newpage()
pushViewport(vp)
draw(
anno_var_hist(
data = fakeData, fun = sqrt,
vars = rev(names(fakeData)), n_breaks = 5,
which = "column", gp = grid::gpar(fill = 2:6, lwd = c(0.9, 2.5))
)
)