Helper to specify a HeatmapAnnotation for taxa
Usage
taxAnnotation(
  ...,
  name,
  annotation_legend_param = list(),
  show_legend = TRUE,
  gp = grid::gpar(col = NA),
  border = FALSE,
  gap = grid::unit(2, "mm"),
  show_annotation_name = TRUE,
  annotation_label = NULL,
  annotation_name_gp = grid::gpar(),
  annotation_name_offset = NULL,
  annotation_name_rot = NULL,
  annotation_name_align = TRUE,
  annotation_name_side = "auto",
  .data = NULL,
  .taxa = NULL,
  .side = NULL
)
Arguments
- ...
Name-value pairs where the names correspond to annotation names and values are the output of taxon annotation functions such as anno_tax_prev() or manually specified AnnotationFunction objects
- name
Name of the heatmap annotation, optional.
- annotation_legend_param
A list which contains parameters for annotation legends. See
color_mapping_legend,ColorMapping-methodfor all possible options.- show_legend
Whether show annotation legends. The value can be one single value or a vector.
- gp
Graphic parameters for simple annotations (with
fillparameter ignored).- border
border of single annotations.
- gap
Gap between annotations. It can be a single value or a vector of
unitobjects.- show_annotation_name
Whether show annotation names? For column annotation, annotation names are drawn either on the left or the right, and for row annotations, names are draw either on top or at the bottom. The value can be a vector.
- annotation_label
Labels for the annotations. By default it is the same as individual annotation names.
- annotation_name_gp
Graphic parameters for annotation names. Graphic parameters can be vectors.
- annotation_name_offset
Offset to the annotation names, a
unitobject. The value can be a vector.- annotation_name_rot
Rotation of the annotation names. The value can be a vector.
- annotation_name_align
Whether to align the annotation names.
- annotation_name_side
Side of the annotation names.
- .data
OPTIONAL phyloseq or psExtra, only set this to override use of same data as in heatmap
- .taxa
OPTIONAL selection vector of taxa (names, numbers or logical), only set this if providing .data argument to override default
- .side
OPTIONAL string, indicating the side the taxa annotation should be placed: only set this to override default
Examples
library("ComplexHeatmap")
data("ibd", package = "microViz")
psq <- tax_filter(ibd, min_prevalence = 5)
psq <- tax_mutate(psq, Species = NULL)
psq <- tax_fix(psq)
psq <- tax_agg(psq, rank = "Family")
taxa <- tax_top(psq, n = 15, rank = "Family")
customAxis <- list(labels_rot = 0, at = c(0, 0.5, 1))
# makes a function that takes data, taxa and which (at minimum)
fun <- taxAnnotation(
gap = grid::unit(2.5, "mm"),
Prev. = anno_tax_prev(axis_param = customAxis, ylim = c(0, 1), extend = 0),
`Prop. Abd.` = anno_tax_box(size = unit(40, "mm"), axis_param = customAxis),
`Log10p Abd.` = anno_tax_density(type = "heatmap")
)
# manually specify the prevalence barplot function by giving it data etc.
heatmapAnnoFunction <- fun(.data = psq, .side = "top", .taxa = taxa)
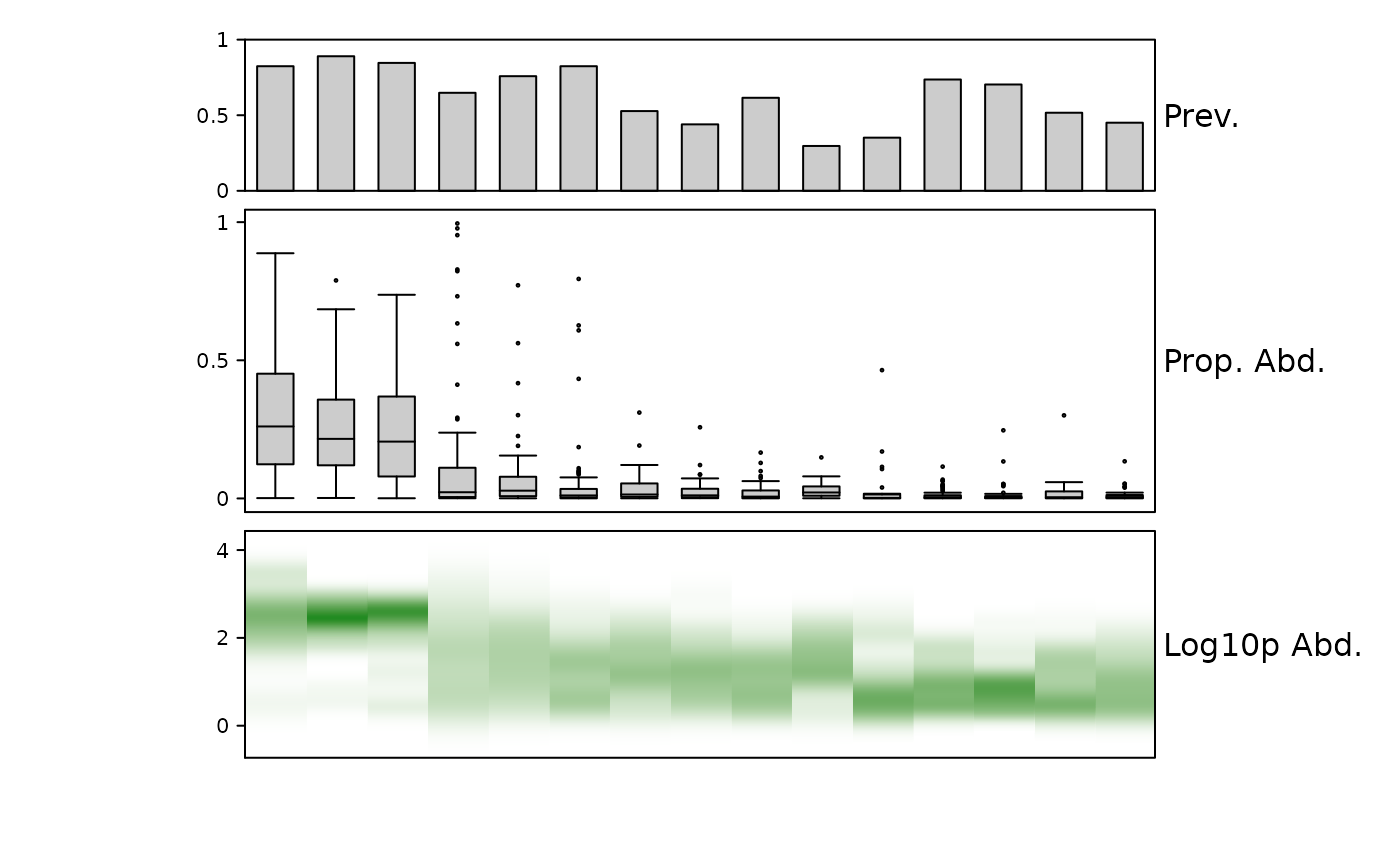
# draw the annotation without a heatmap, you will never normally do this!
grid.newpage()
vp <- viewport(width = 0.65, height = 0.75)
pushViewport(vp)
draw(heatmapAnnoFunction)
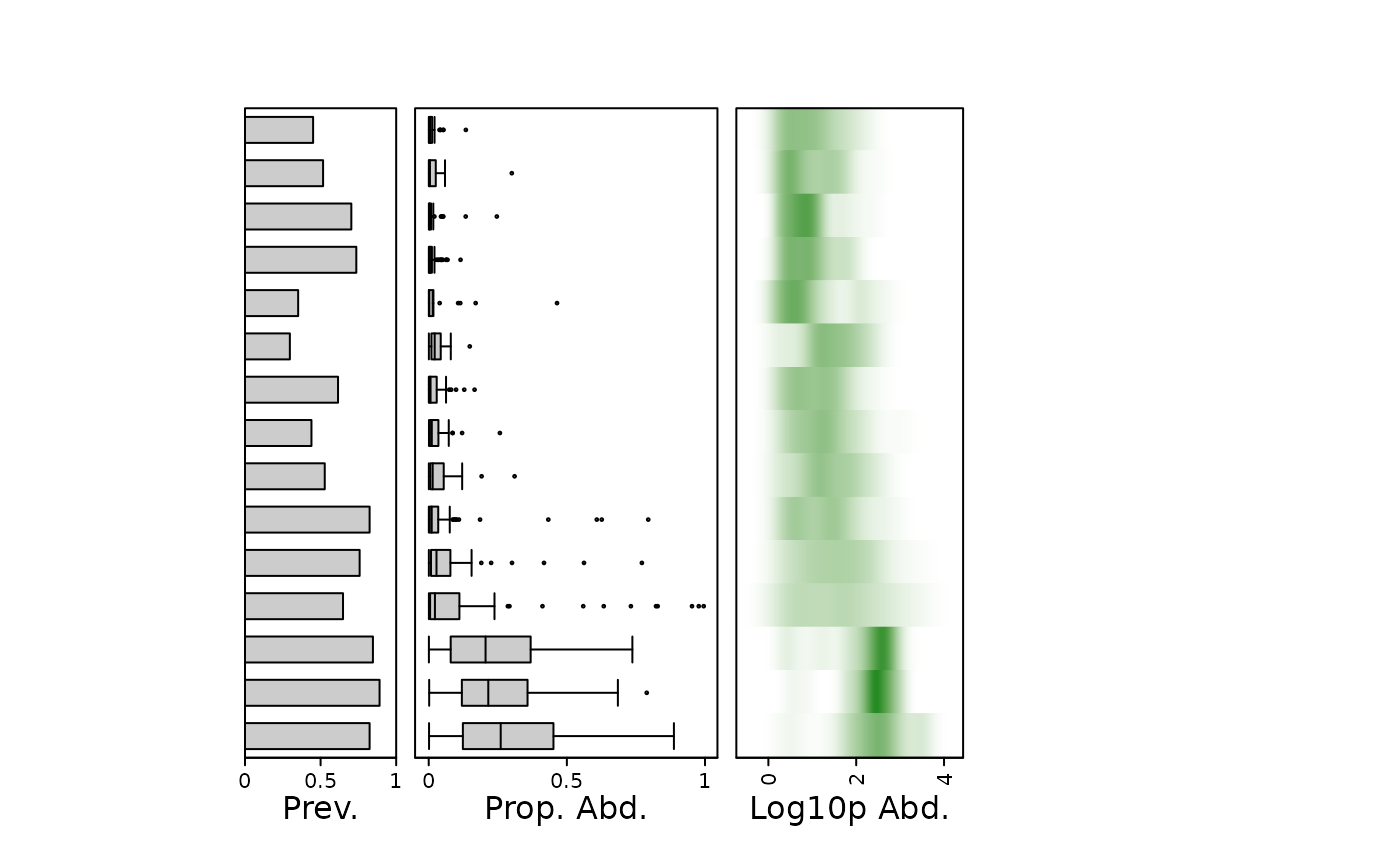
 # try again as a row annotation
grid.newpage()
pushViewport(vp)
draw(fun(.data = psq, .side = "right", .taxa = rev(taxa)))
# try again as a row annotation
grid.newpage()
pushViewport(vp)
draw(fun(.data = psq, .side = "right", .taxa = rev(taxa)))