Draw labelled key to accompany taxatree_plots
Usage
taxatree_plotkey(
  data,
  ...,
  size_stat = list(prevalence = prev),
  node_size_range = c(1.5, 5),
  edge_width_range = node_size_range * 0.8,
  size_guide = "none",
  size_trans = "identity",
  colour = "lightgrey",
  edge_alpha = 0.7,
  title = "Key",
  title_size = 14,
  taxon_renamer = identity,
  .combine_label = any,
  .draw_label = TRUE,
  .calc_label = TRUE,
  layout = "tree",
  layout_seed = NA,
  circular = identical(layout, "tree"),
  node_sort = NULL,
  add_circles = isTRUE(circular),
  drop_ranks = TRUE
)
Arguments
- data
psExtra (or phyloseq)
- ...
logical conditions for labelling e.g. rank == "Phylum", p.value < 0.1 | taxon %in% listOfTaxa
- size_stat
named list of length 1, giving function calculated for each taxon, to determine the size of nodes (and edges). Name used as size legend title.
- node_size_range
min and max node sizes, decrease to avoid node overlap
- edge_width_range
min and max edge widths
- size_guide
guide for node sizes, try "none", "legend" or ggplot2::guide_legend()
- size_trans
transformation for size scale you can use (the name of) any transformer from the scales package, such as "identity", "log1p", or "sqrt"
- colour
fixed colour and fill of nodes and edges
- edge_alpha
fixed alpha value for edges
- title
title of plot (NULL for none)
- title_size
font size of title
- taxon_renamer
function that takes taxon names and returns modified names for labels
- .combine_label
all or any: function to combine multiple logical "label" values for a taxon (relevant if taxatree_stats already present in data)
- .draw_label
should labels be drawn, or just the bare tree, set this to FALSE if you want to draw customised labels with taxatree_plot_labels afterwards
- .calc_label
if you already set labels with taxatree_label: set this to FALSE to use / avoid overwriting that data (ignores
...if FALSE)- layout
any ggraph layout, default is "tree"
- layout_seed
any numeric, required if a stochastic igraph layout is named
- circular
should the layout be circular?
- node_sort
sort nodes by "increasing" or "decreasing" size? NULL for no sorting. Use
tax_sort()beforetaxatree_plots()for finer control.- add_circles
add faint concentric circles to plot, behind each rank?
- drop_ranks
drop ranks from tree if not included in stats dataframe
Examples
library(ggplot2)
# Normally you make a key to accompany taxatree_plots showing stats results
# So see ?taxatree_plots examples too!
#
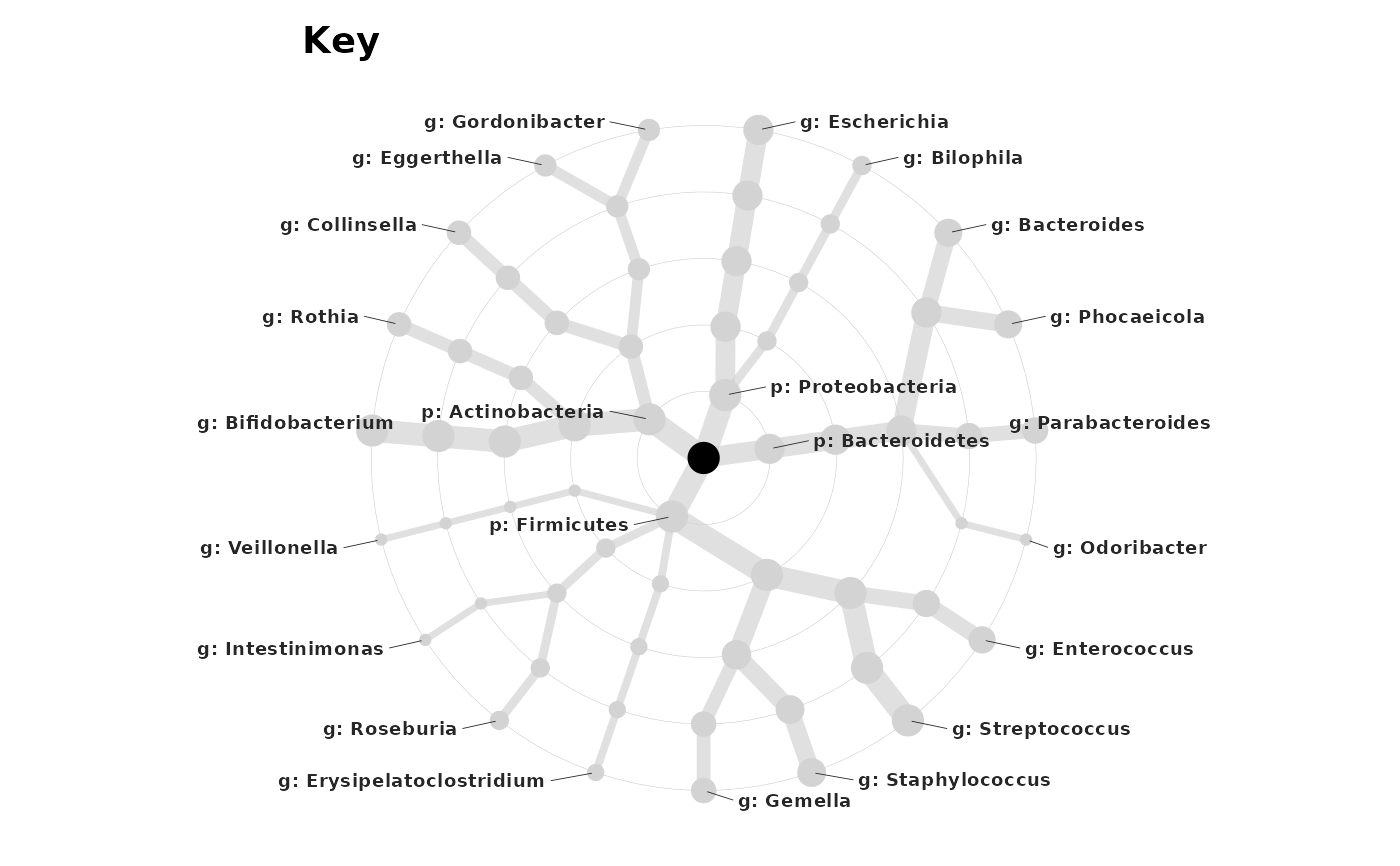
# You can also use the taxatree key visualization just to help understand your
# tax_table contents and hierarchical structure
shao19 %>%
ps_filter(family_id %in% 1:5) %>%
tax_filter(min_prevalence = 7) %>%
tax_fix() %>%
tax_agg("genus") %>%
tax_prepend_ranks() %>%
taxatree_plotkey(rank %in% c("phylum", "genus"))
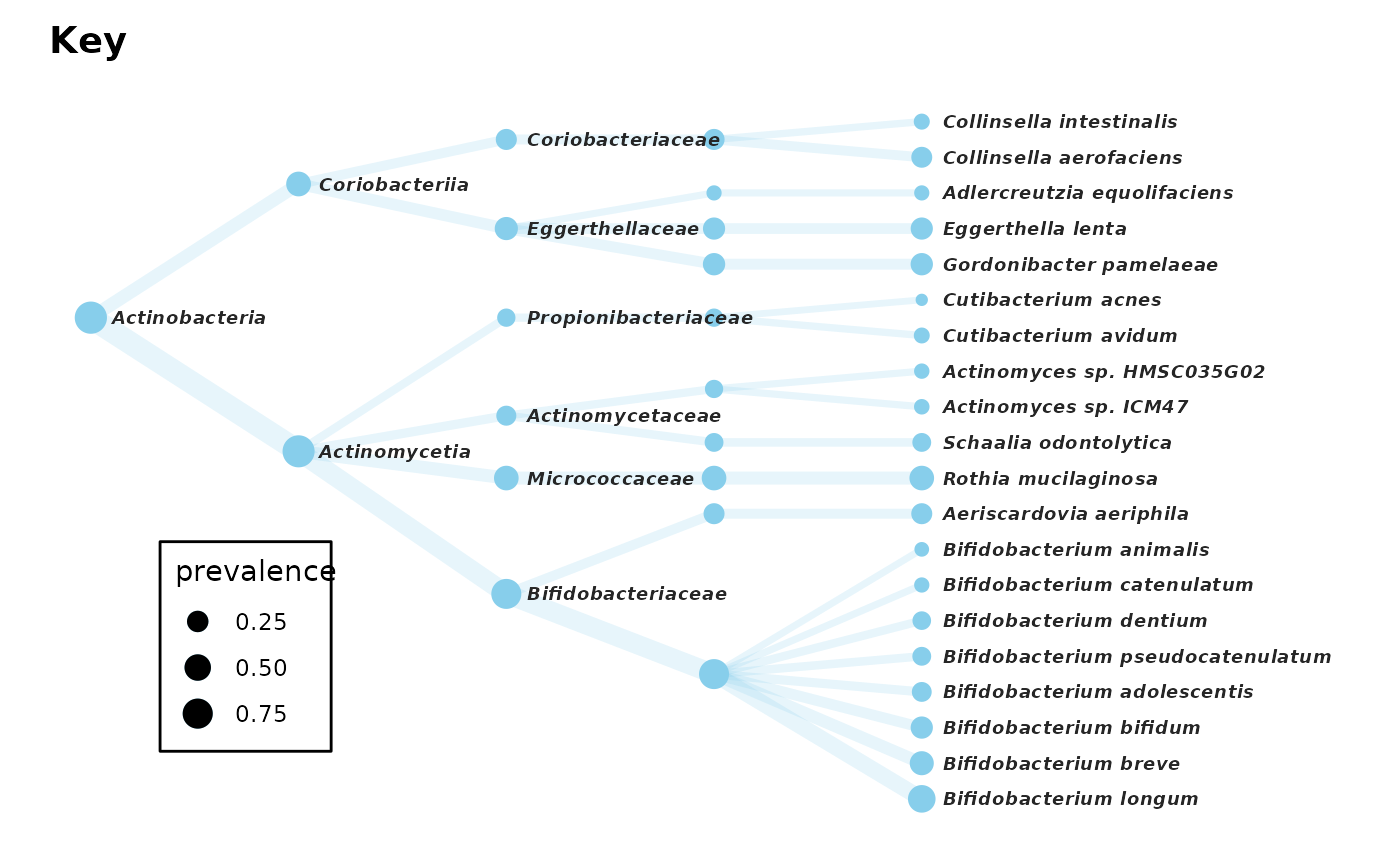
 # # Let's look at some of the most prevalent Actinobacteria
actinoOnlyPhylo <- shao19 %>%
tax_select("Actinobacteria", ranks_searched = "phylum") %>%
tax_filter(min_prevalence = 100)
actinoOnlyPhylo %>%
tax_mutate(order = NULL) %>%
tax_sort(by = "prev", at = "species", tree_warn = FALSE) %>%
taxatree_plotkey(
circular = FALSE, rank != "genus",
.draw_label = FALSE, # suppress drawing now so we can make custom labels after
size_guide = "legend", colour = "skyblue", edge_alpha = 0.2
) %>%
taxatree_plot_labels(
circular = FALSE, # be sure you match the plotkey layout
fun = geom_text, fontface = "bold.italic", size = 2.5, hjust = 0,
nudge_y = 0.1 # nudge y if you want to nudge x (due to coord_flip!)
) +
coord_flip(clip = "off") +
scale_y_reverse(expand = expansion(add = c(0.2, 2))) +
theme(legend.position = c(0.15, 0.25), legend.background = element_rect())
# # Let's look at some of the most prevalent Actinobacteria
actinoOnlyPhylo <- shao19 %>%
tax_select("Actinobacteria", ranks_searched = "phylum") %>%
tax_filter(min_prevalence = 100)
actinoOnlyPhylo %>%
tax_mutate(order = NULL) %>%
tax_sort(by = "prev", at = "species", tree_warn = FALSE) %>%
taxatree_plotkey(
circular = FALSE, rank != "genus",
.draw_label = FALSE, # suppress drawing now so we can make custom labels after
size_guide = "legend", colour = "skyblue", edge_alpha = 0.2
) %>%
taxatree_plot_labels(
circular = FALSE, # be sure you match the plotkey layout
fun = geom_text, fontface = "bold.italic", size = 2.5, hjust = 0,
nudge_y = 0.1 # nudge y if you want to nudge x (due to coord_flip!)
) +
coord_flip(clip = "off") +
scale_y_reverse(expand = expansion(add = c(0.2, 2))) +
theme(legend.position = c(0.15, 0.25), legend.background = element_rect())
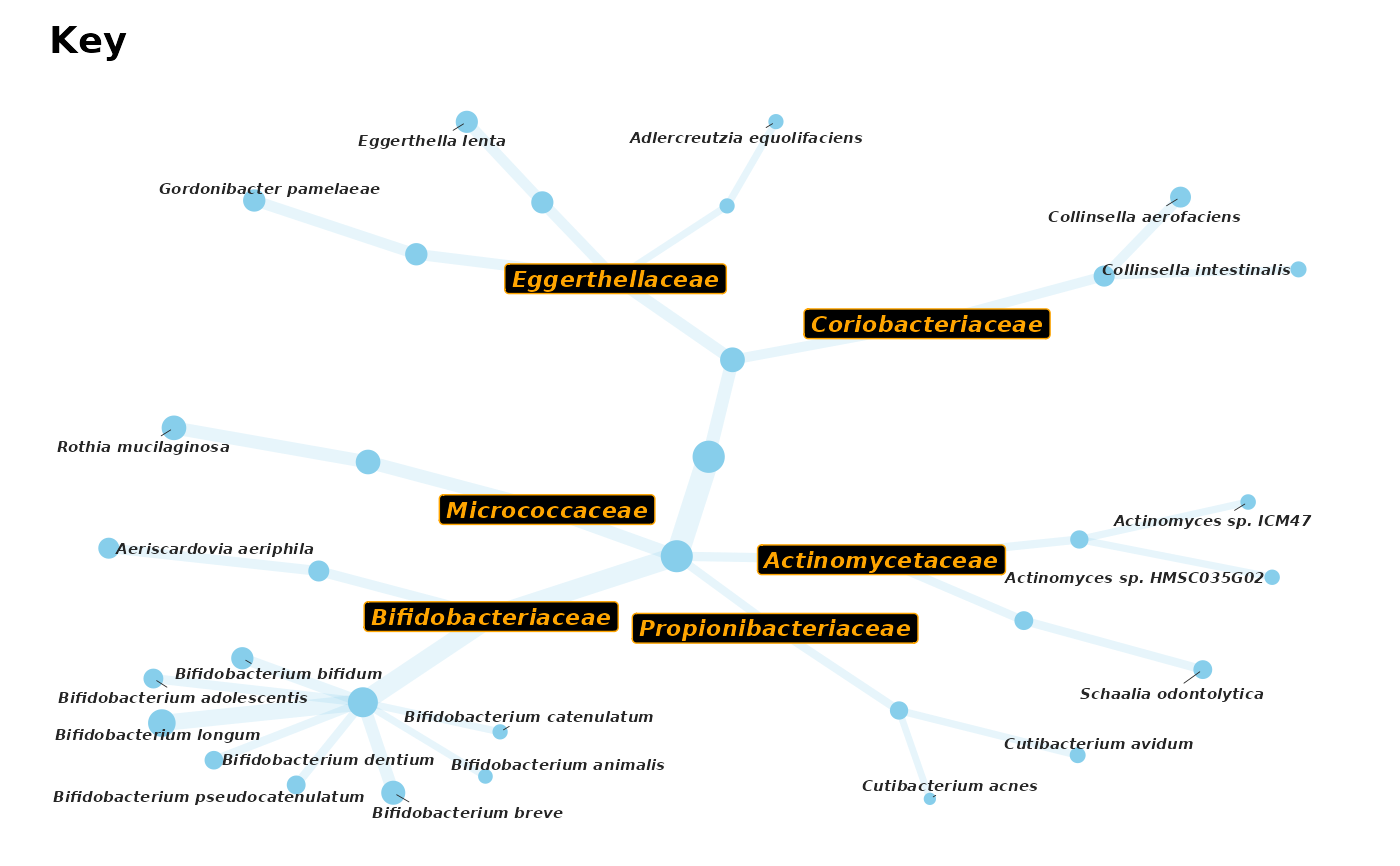
 # You can even choose other tree layouts from igraph (e.g. kk)
# and configure multiple styles of custom labels on one plot
set.seed(1) # set seed for reproducibility of ggrepel label positions
actinoOnlyPhylo %>%
tax_mutate(order = NULL) %>%
taxatree_label(rank == "family", .label_var = "family_lab") %>%
taxatree_label(rank == "species", .label_var = "species_lab") %>%
taxatree_plotkey(
circular = FALSE, rank != "genus", layout = "kk",
.draw_label = FALSE, # important not to draw the default labels
colour = "skyblue", edge_alpha = 0.2
) %>%
taxatree_plot_labels(
circular = FALSE, label_var = "family_lab", fun = geom_label,
fontface = "bold.italic", colour = "orange", fill = "black", size = 3
) %>%
taxatree_plot_labels(
circular = FALSE, label_var = "species_lab", fun = ggrepel::geom_text_repel,
fontface = "bold.italic", size = 2, force = 20, max.time = 0.1
)
# You can even choose other tree layouts from igraph (e.g. kk)
# and configure multiple styles of custom labels on one plot
set.seed(1) # set seed for reproducibility of ggrepel label positions
actinoOnlyPhylo %>%
tax_mutate(order = NULL) %>%
taxatree_label(rank == "family", .label_var = "family_lab") %>%
taxatree_label(rank == "species", .label_var = "species_lab") %>%
taxatree_plotkey(
circular = FALSE, rank != "genus", layout = "kk",
.draw_label = FALSE, # important not to draw the default labels
colour = "skyblue", edge_alpha = 0.2
) %>%
taxatree_plot_labels(
circular = FALSE, label_var = "family_lab", fun = geom_label,
fontface = "bold.italic", colour = "orange", fill = "black", size = 3
) %>%
taxatree_plot_labels(
circular = FALSE, label_var = "species_lab", fun = ggrepel::geom_text_repel,
fontface = "bold.italic", size = 2, force = 20, max.time = 0.1
)