Which taxon is most abundant in each sample of your phyloseq object? This function adds this information as a new variable in your phyloseq sample_data.
If the most abundant taxon is below the proportional abundance threshold, the dominant taxon will be "none" for that sample
If there are more than n_max dominant taxa across all samples (not including "none") the dominant taxon will be "other" for those samples
Usage
ps_calc_dominant(
  ps,
  rank,
  threshold = 0.3,
  n_max = 6,
  var = paste("dominant", rank, sep = "_"),
  none = "none",
  other = "other"
)
Arguments
- ps
phyloseq object
- rank
taxonomic rank to calculate dominance at
- threshold
minimum proportion at which to consider a sample dominated by a taxon
- n_max
maximum number of taxa that can be listed as dominant taxa
- var
name of variable to add to phyloseq object sample data
- none
character value to use when no taxon reaches threshold
- other
character value to use when another taxon (>n_max) dominates
Examples
library(ggplot2)
ps <- microViz::ibd %>%
tax_filter(min_prevalence = 3) %>%
tax_fix() %>%
phyloseq_validate()
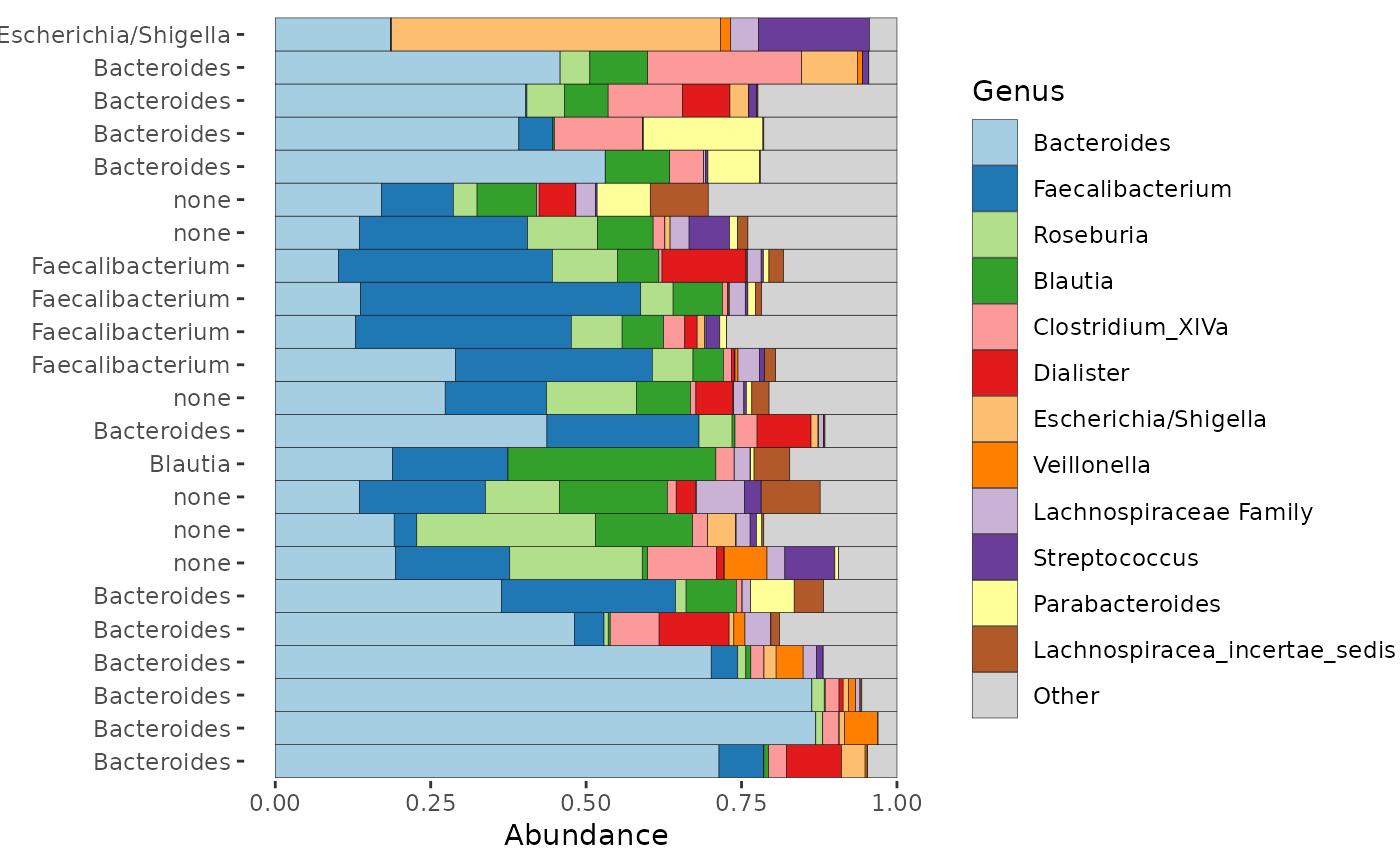
ps %>%
ps_filter(DiseaseState == "CD") %>%
ps_calc_dominant(rank = "Genus") %>%
comp_barplot(tax_level = "Genus", label = "dominant_Genus", n_taxa = 12) +
coord_flip()
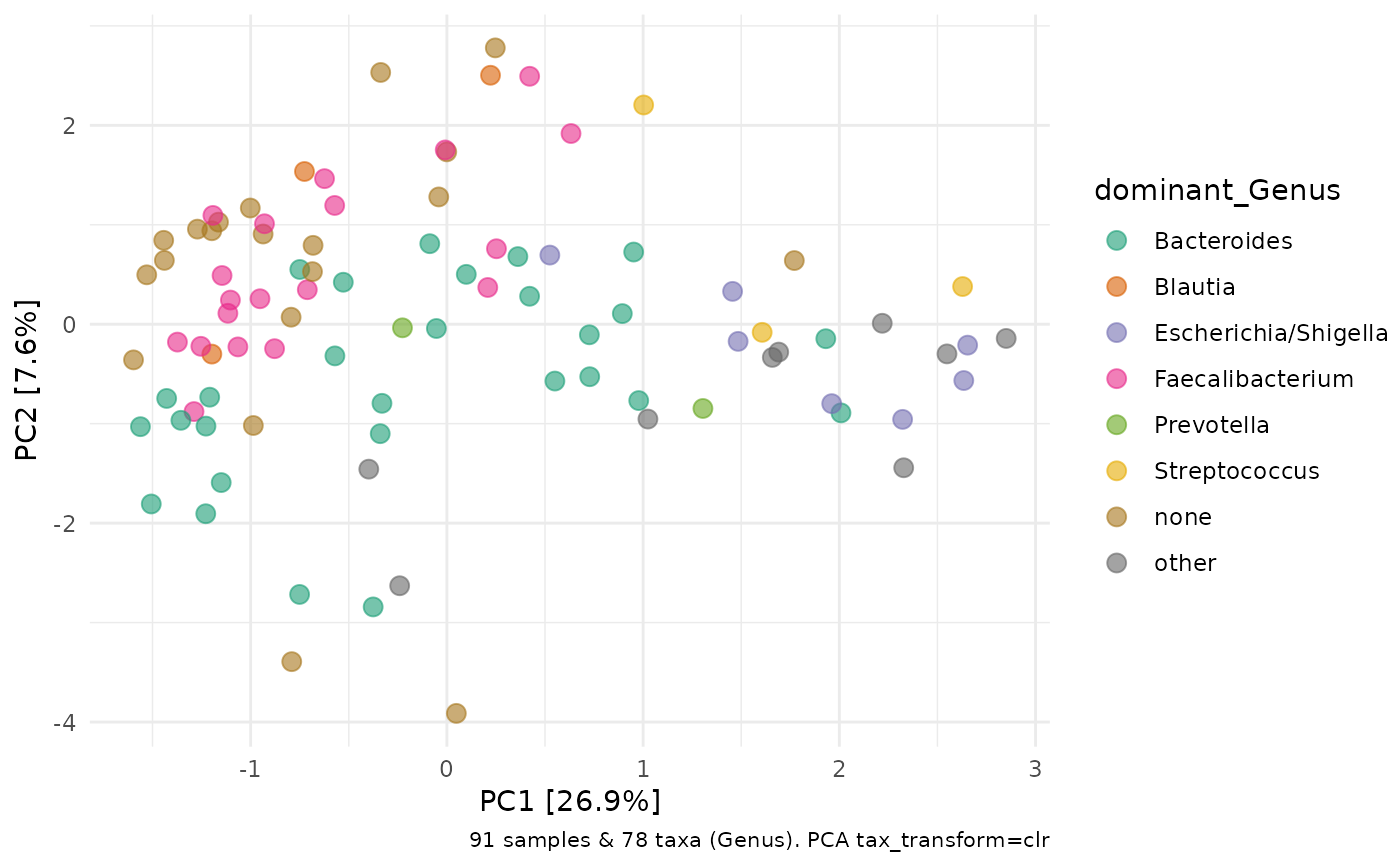
 ps %>%
ps_calc_dominant(rank = "Genus") %>%
tax_transform(rank = "Genus", trans = "clr") %>%
ord_calc("PCA") %>%
ord_plot(colour = "dominant_Genus", size = 3, alpha = 0.6) +
scale_colour_brewer(palette = "Dark2")
ps %>%
ps_calc_dominant(rank = "Genus") %>%
tax_transform(rank = "Genus", trans = "clr") %>%
ord_calc("PCA") %>%
ord_plot(colour = "dominant_Genus", size = 3, alpha = 0.6) +
scale_colour_brewer(palette = "Dark2")
 # customise function options
ps %>%
ps_calc_dominant(
rank = "Family", other = "Other", none = "Not dominated",
threshold = 0.4, n_max = 3
) %>%
tax_transform(rank = "Genus", trans = "clr") %>%
ord_calc("PCA") %>%
ord_plot(colour = "dominant_Family", size = 3, alpha = 0.6) +
scale_colour_manual(values = c(
Bacteroidaceae = "forestgreen", Lachnospiraceae = "darkblue",
Ruminococcaceae = "darkorange", Other = "red", "Not dominated" = "grey"
))
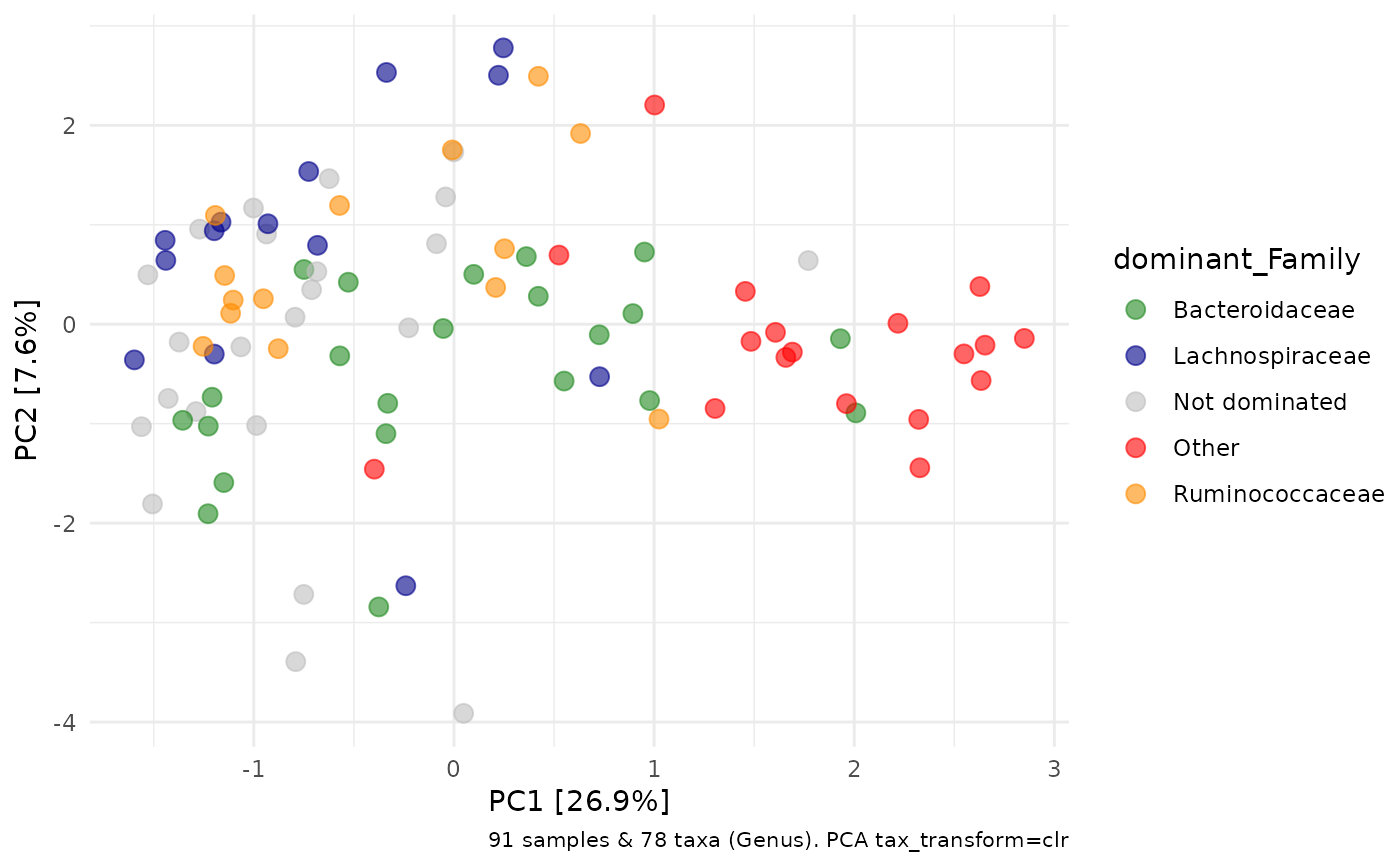
# customise function options
ps %>%
ps_calc_dominant(
rank = "Family", other = "Other", none = "Not dominated",
threshold = 0.4, n_max = 3
) %>%
tax_transform(rank = "Genus", trans = "clr") %>%
ord_calc("PCA") %>%
ord_plot(colour = "dominant_Family", size = 3, alpha = 0.6) +
scale_colour_manual(values = c(
Bacteroidaceae = "forestgreen", Lachnospiraceae = "darkblue",
Ruminococcaceae = "darkorange", Other = "red", "Not dominated" = "grey"
))